
Von Zielverbindungen und Kandidaten rückwärts planen
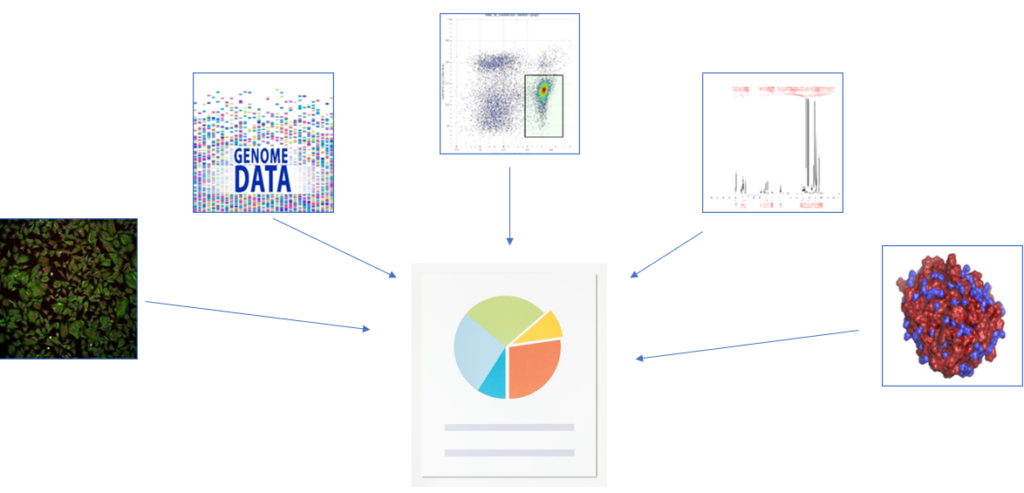
Verbindet Krankheitskontext, vorhandene Daten, Bildgebung, Omics und Strukturindikatoren, um Wirksamkeit, Toxizität und Mechanismen zu definieren.
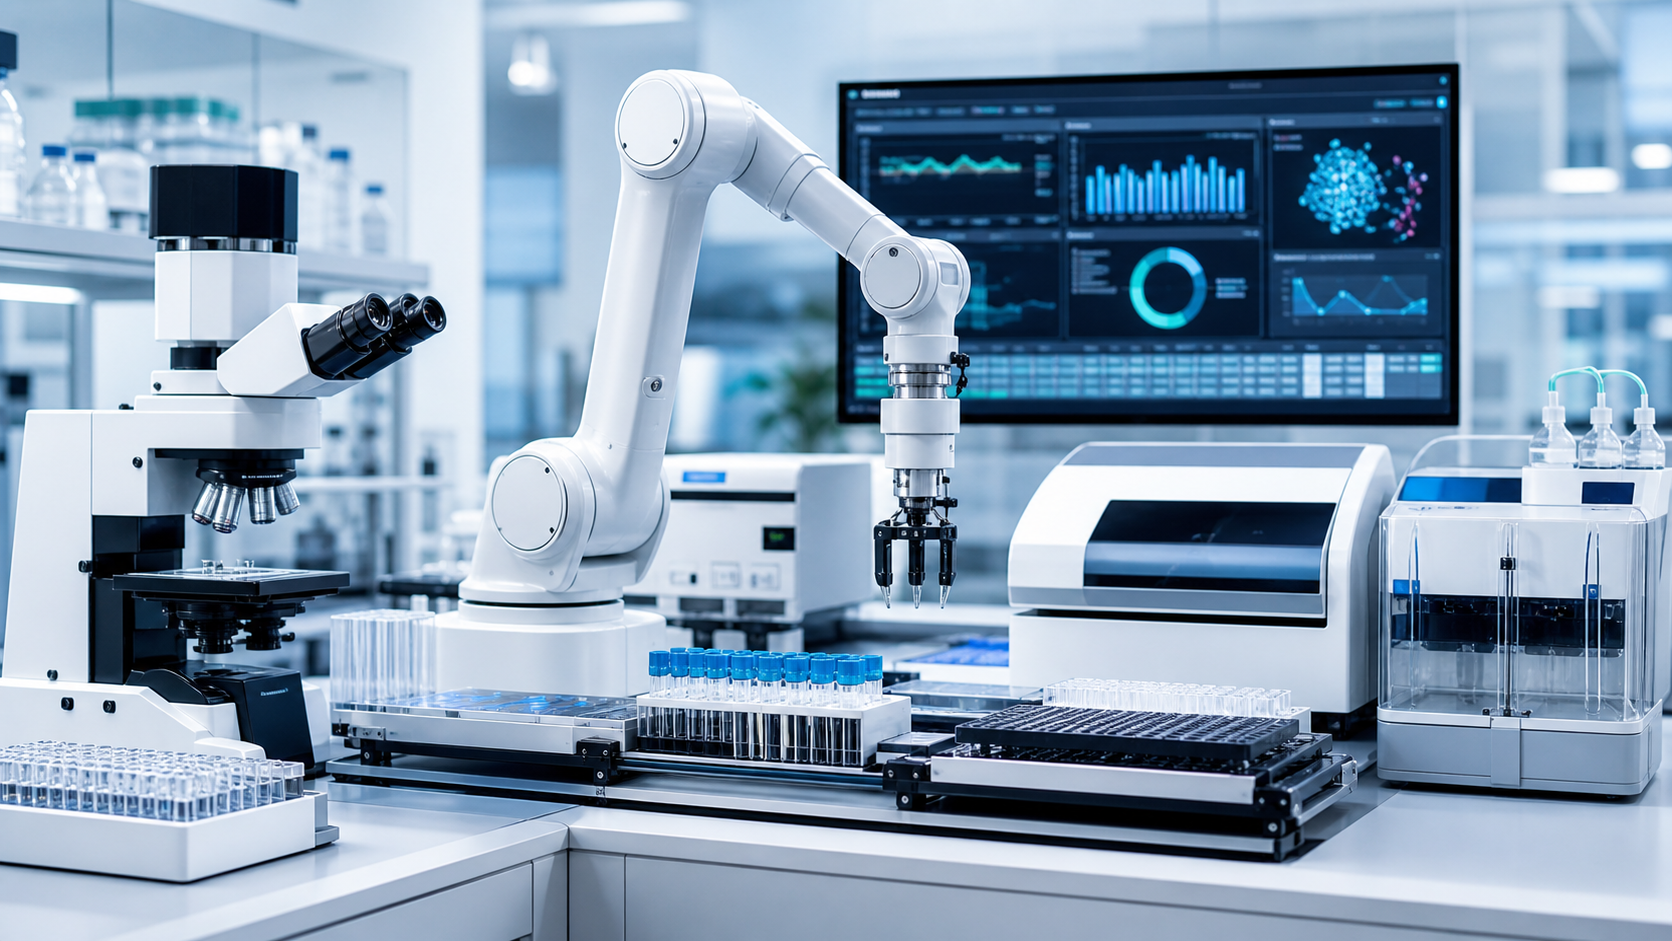
Integrate Analysis System IAS
IAS is not a replacement for every point tool. It is a web-based workflow layer that brings fragmented research data, analysis procedures, review records, and report creation into the same context.
IAS ersetzt keine modalitätsspezifischen Tools. Es verbindet experimentbezogene Daten, Analyse, Review und Reporting auf einer gemeinsamen Entscheidungsfläche.
Bildgebung, Durchflusszytometrie, Genomik, Massenspektrometrie und Molekülstrukturen werden pro Experiment geordnet.
Modalitätsspezifische Analyseverfahren laufen im selben Workspace und reduzieren manuelle Übergaben.
Mehrere Assay-Ergebnisse werden zu einer Forschungsentscheidung verknüpft, damit Vergleich und Interpretation schneller werden.
Analysehistorie, Prüfungen und Reporting werden zu reproduzierbaren finalen Ergebnissen verbunden.
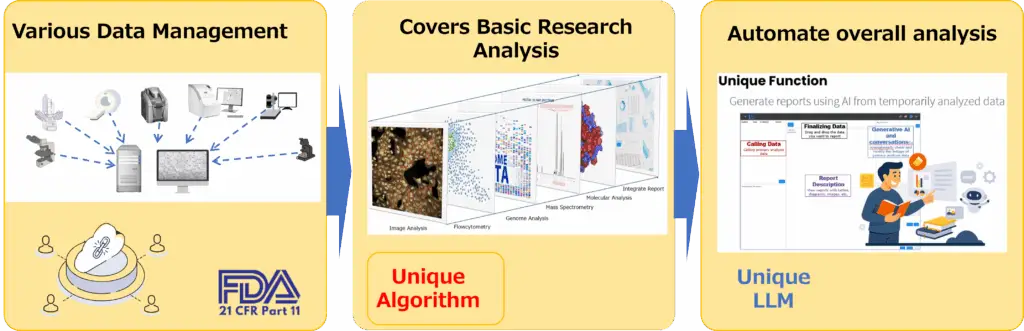
IAS zeigt nicht nur Analyseergebnisse. Es ordnet Zielverbindungen, Wirkstoffkandidaten, Hypothesen, Bewertungsmetriken und nächste Bedingungen für Simulation und Nasslaborplanung.
Neben besserer Analyse, Interpretation und Berichterstellung erhöht IAS die Qualität des Versuchsdesigns und verkürzt den Zyklus von Kandidatensuche bis Nassvalidierung.
Verbindet Krankheitskontext, vorhandene Daten, Bildgebung, Omics und Strukturindikatoren, um Wirksamkeit, Toxizität und Mechanismen zu definieren.
Führt vielversprechende Bedingungen, Vergleichsgruppen und Messparameter in die nächste in silico Prüfung oder Versuchsplanung zurück.
Weniger aussichtsreiche Bedingungen werden früher ausgesiebt, damit Experimente, Prüfungen und Reviews auf die wichtigsten Hypothesen fokussieren.
NEW FEATURE
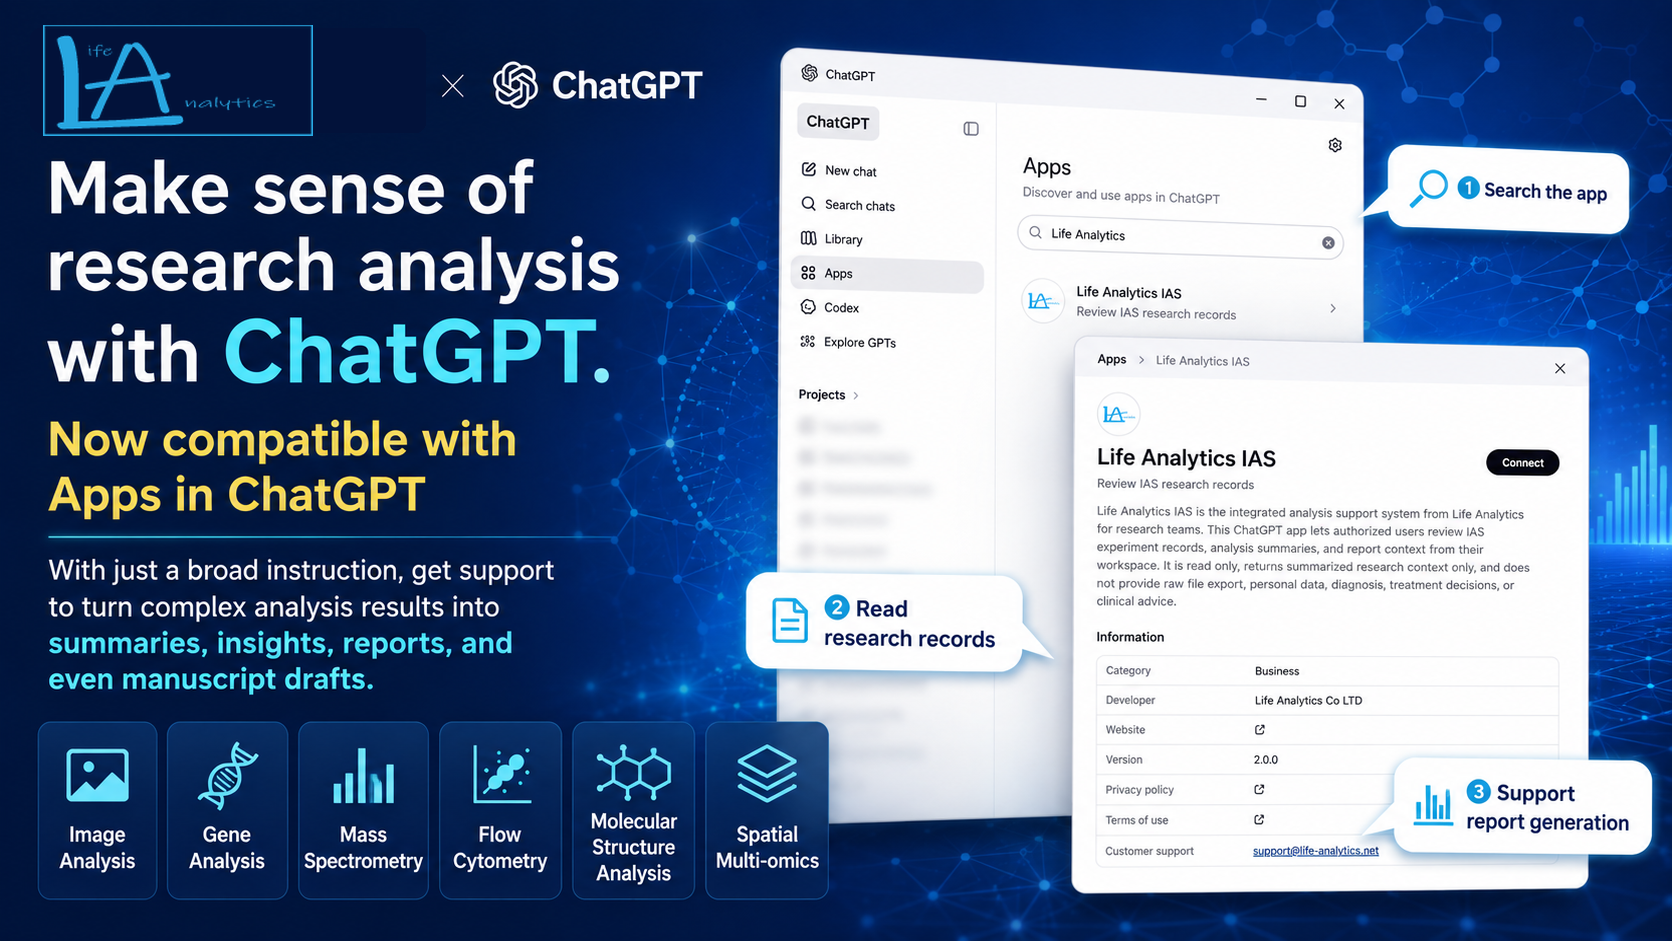
Helping researchers summarize, interpret, and draft reports from complex analysis results through natural language instructions.
LifeAnalytics IAS now supports ChatGPT and LifeAnalytics' proprietary generative AI application. Using research data, analysis history, experiment records, analysis summaries, and report context, IAS helps researchers summarize, interpret, create reports, and draft scientific manuscripts from complex life science analysis results.
IAS supports multiple analysis areas including image analysis, gene analysis, flow cytometry, mass spectrometry, molecular structure analysis, spatial multi-layer multi-omics analysis, and integrated analysis.
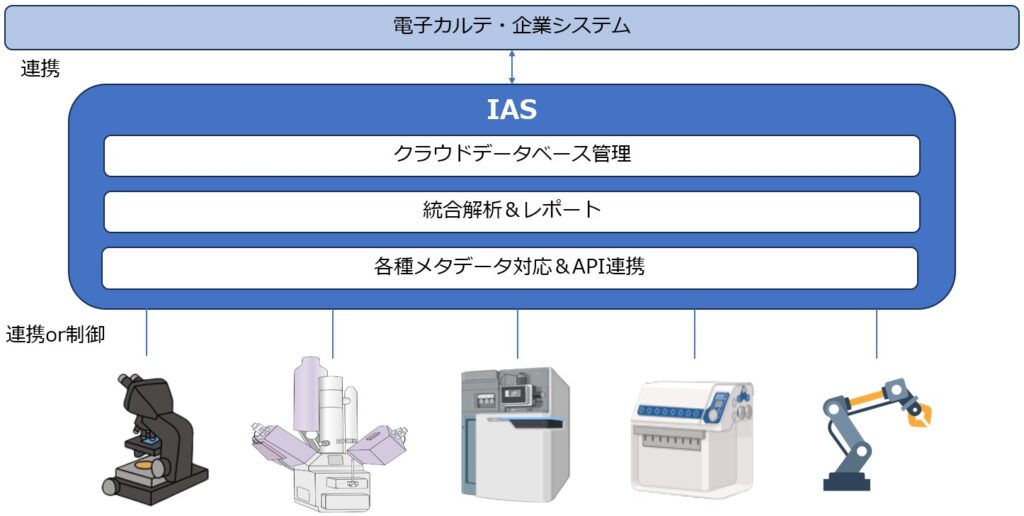
IAS verwaltet Bildanalyse, Durchflusszytometrie, Next-Generation-Sequencing, Molekülstrukturen und Massenspektrometrie zentral in der Cloud.
Visualization, alignment, assembly, and annotation of DNA and protein sequences.
Acquisition, processing, and analysis of mass spectrometry data, including metabolomics.
High-accuracy prediction of 3D protein structure from amino acid sequences.
AI-assisted discussion reports based on individual analysis results.
Image analysis for cells and tissue sections, including 3D, Timelapse, HCS, and pathology.
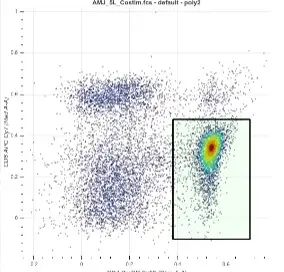
Flow cytometry analysis such as SPADE, U-MAP, and dot plots.
IAS specification details
Handle imaging, flow cytometry, genomics, mass spectrometry, molecular structure, and integrated analysis in one research workbench.
IAS is not a single image-analysis application or a collection of isolated point tools. It brings imaging, flow cytometry, genomics, mass spectrometry, molecular structure analysis, integrated analysis, and data management into one research workbench experience.
IAS AI output does not guarantee clinical diagnosis. Interpretation of pathology images, medical images, genomics, molecular structure, and mass-spec results should be combined with specialist review, raw-data inspection, standard methods, and external validation.
 Workflow diagram
Each card summarizes inputs, outputs, and review points at a practical evaluation level.

Long model inventories are grouped by purpose so readers can see how each model is used and what should be checked before interpreting outputs.
IAS imaging modes cover Tissue, Cell, Material, Semicon, Animal, and ML workflows so teams can choose models by purpose.
TissueNet, Foxp3 Spatial, Foxp3 DAB Spatial, Ki67-Br, Pathology, CT/MRI Segment, Spatial Omics, TissueNT2, Thyroid, and Lymph support tissue segmentation, ROI quantification, positivity review, spatial distribution, and multi-channel statistics.
Cyto, Cyto2, SAM, 2Dtracker, 3Dtimelapse, Nuclei, Nucleus01, Confluency, CM-CellCycle, LiveCell, CP, CPx, TN1-3, LC1-4, Single Cell Protein, 3DVD, LFcell02, and CellPaintingV3 support cell segmentation, tracking, morphology profiling, localization, and state review.
Pore Analysis, Layer, Microridge, Mfiber1, Mfiber2, Wafer, Mouse Dynamics Tracking, and Pixel Classification support pore, layer, ridge, fiber, wafer, animal motion, and user-defined pixel-classification reviews.

Pathology mode combines local pathology processing, ROI editing, vision-language assistance, visual similarity, and nuclei/cell segmentation support.
OpenSlide, tifffile, OpenCV, and LAB/HSV/RGB Magic Wand support tissue masks, tile heatmaps, overlays, and color-space ROI editing.
Qwen2.5-VL + LoRA assist, ResNet152 visual similarity, and DeepLIIF biomarker support help generate descriptions, hypotheses, similar-image candidates, and biomarker-support summaries.
checkpoint-gated tumor segmentation, StarDist H&E nuclei, Cellpose-SAM service, and InstanSeg service provide candidate segmentation for tumor regions, nuclei, and cells.
This is not a diagnostic function. Outputs are research and review support for specialist-led pathology review.
IAS connects FCS input, compensation, QC, gates, embedding, clustering, statistics, and reporting.
Compensation, spectral unmixing, PeacoQC, DataQC, doublet checks, and margin checks help review spillover, spectral overlap, abnormal events, flow-rate drift, doublets, and margin events.
Gate editor, Boolean gates, UMAP, t-SNE, opt-SNE, and viSNE help preserve manual thresholds and inspect high-dimensional cytometry data.
FlowSOM, SPADE, CITRUS, population statistics, and marker summaries support population comparison, MFI review, figures, and reports.
Embeddings are visualizations; interpretation should be checked against marker expression and manual gates.

IAS organizes sequence similarity, alignment, variants, single-cell analysis, reference mapping, and multi-omics evidence by experiment.
BLAST, MSA, Phylogeny, CRISPR, QC & Alignment, Variant Calling, Joint Genotyping, and Annotation connect sequence review to variant and annotation review.
Genome Browser and Single-cell Async support genomic-region inspection, variants, gene models, normalization, HVG, PCA, clustering, UMAP, and marker detection.
Harmony, scGPT, cell annotation capability checks, and Multi-Omics connect batch correction, reference mapping, cell-type annotation candidates, expression, variants, phenotypes, and other modes.
Check genome build, QC, depth, population frequency, labeled references, batch effects, missingness, and unit alignment.

IAS connects raw/mzML/mgf/wiff inputs to peak features, identification, quantification, QC, database matching, reports, and multi-omics.
MS-DIAL, XCMS, MZmine, MS-FINDER, MS-CleanR, LipidSearch, and LipidBlast outputs are organized for candidate review and quantification.
MaxQuant, Proteome Discoverer, FragPipe, Mascot, Byonic, Spectronaut, DIA-NN, OpenSWATH, Prosit, SCiLS Lab, Cardinal, MSiReader, METASPACE, and OpenMSI outputs can be reviewed as part of the same workflow.
MRM/SRM/PRM, MRMProbs, DeepNovo, Spec2Vec, MS2DeepScore, AlphaPept, mixOmics, MOFA(+), DIABLO, and OmicsNet outputs can be tied back to research decisions.
AI candidates should be verified with database matching, standards, MS/MS evidence, FDR, QC, blanks, and batch correction.

IAS helps review the path from Sequence/PDB/Ligand to structure prediction, docking, MD, validation, and reports.
Monomer and complex structure prediction, public structure retrieval, and pLDDT/PAE review are handled as review inputs.
GNINA, AutoDock-family, LightDock path, OpenMM, and mdtraj support binding-pose candidates, scores, binding-site review, RMSD/RMSF, interactions, and solvent-condition review.
Validation quality checks, reports, function annotation, spectrum prediction, knowledge graph, QM, and FEP scaffolds help organize quality and extension candidates.
Check confidence, pLDDT/PAE, protonation, box, charge, ligand preparation, force field, solvent, temperature, and simulation length.

IAS connects imaging, genomics, mass spec, flow cytometry, molecular structure, and reports around a consistent sample ID.
sample ID and provenance mapping connect sample IDs, experiments, files, and preprocessing history across modes.
compute-statistics, random-effects meta-analysis, and cross-modal review connect effect sizes, confidence intervals, heterogeneity, imaging features, gene expression, metabolites, and population ratios.
Gen Report, report history, evidence maturity, DB Manage, and Sample DB help preserve report context, input history, file references, mode estimation, and re-analysis paths.
For clinical research support, keeping the same sample ID across Imaging, Genomics, MassSpec, and FlowCyto is critical.
Support functions reduce uncertainty during analysis by connecting operation guidance, knowledge search, ROI questions, and help dialogs.
Support Chat connects operation guidance, inquiry handoff, knowledge search, and AI-answer support for Imaging, Genomics, FlowCyto, Molecular, MassSpec, and Integrate.
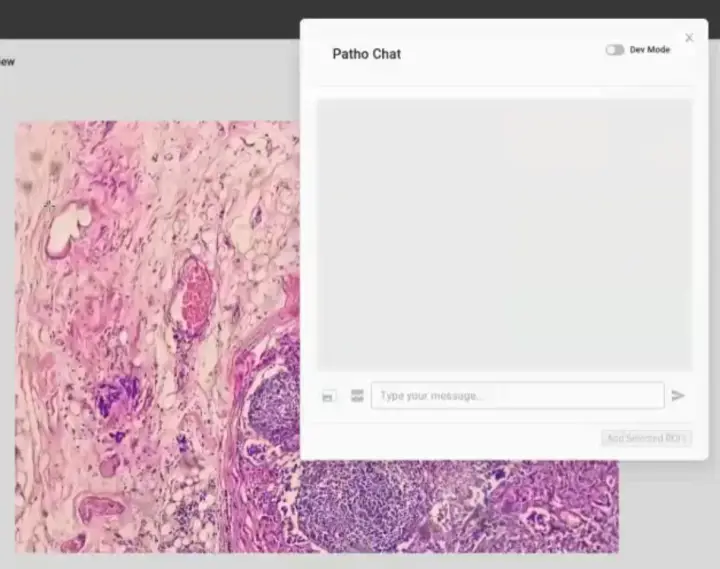
Patho Chat combines ROI crops, feature extraction, similarity candidates, and Qwen-family LLM support to provide finding candidates, differential candidates, and suggested checks under pathology-specialist review.
Q&A icons and Help screens reduce operation mistakes through tooltips, Quick Start, Help dialogs, shortcut explanations, and Support Chat / Patho Chat visibility controls.
Patho Chat does not replace pathology review. Outputs are confirmation support and hypothesis-generation support for selected ROIs.

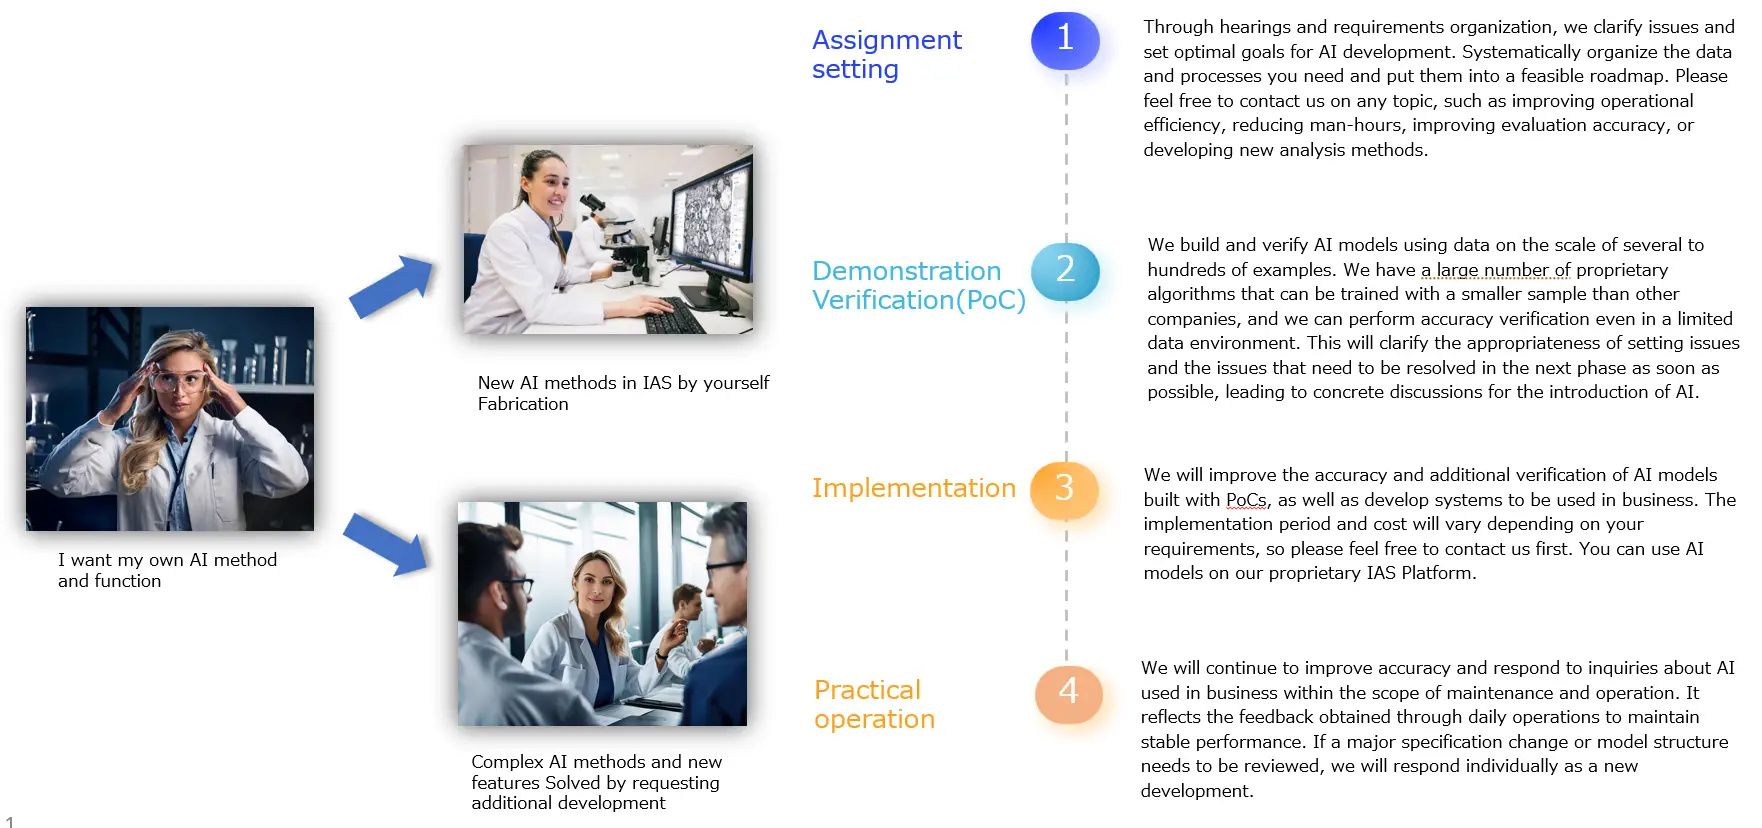
Your target data, analysis problem, and evaluation timing do not need to be fully organized. We can review the appropriate analysis modes and implementation path with you.
Demo consultationAnalyseverfahren werden vereinheitlicht, damit Forschende in derselben Umgebung mit reproduzierbaren Workflows arbeiten können.
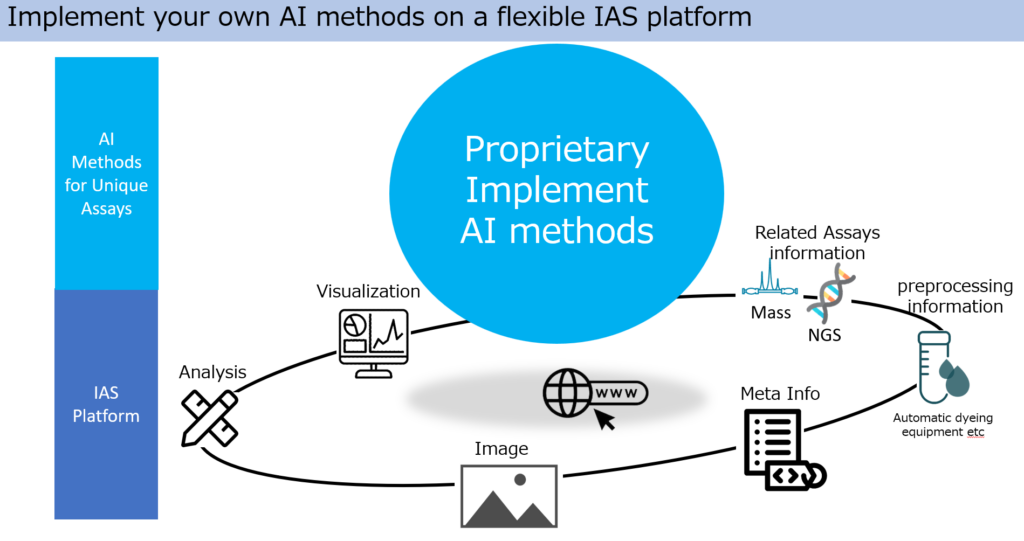
Wir ergänzen zielgerichtete KI- und Analysefunktionen und unterstützen die Automatisierung des gesamten Forschungsprozesses.
Daten, Analysen und Berichte in einem Websystem verwalten.
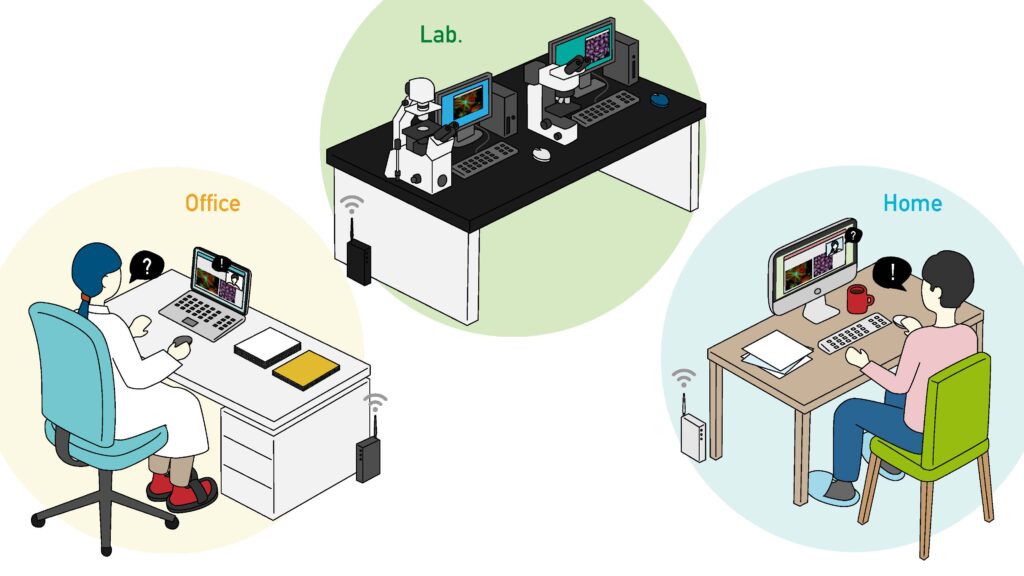
Dieselbe Analyseplattform ohne lokale Installation in Kollaboration und Remote-Umgebungen nutzen.

Fragen und Prüfungen während der Analyse reibungslos bearbeiten.
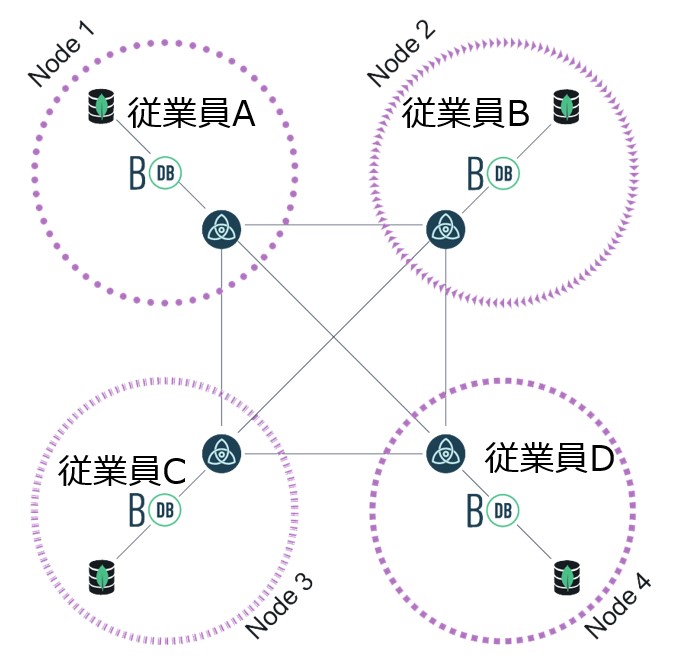
Ausgelegt für Datenmanagement, Schutz vor Datenabfluss und regulatorische Anforderungen.
Unterstützt das Erkennen wichtiger Punkte in Bildern und Analyseergebnissen.
Erleichtert die Integration vielfältiger Forschungsdatenformate.
Spezialisierte Analyseabläufe lassen sich leichter teilen und erhöhen die Reproduzierbarkeit in der Zusammenarbeit aus der Ferne.
Die zentrale Verwaltung mehrerer Datenformate reduziert den Aufwand für Analyse und Berichte.
Unterstützt vielfältige spezielle Bild- und Analyseformate und dient als integriertes Datenanalysesystem.
Kontaktieren Sie uns auch zu Formaten, die hier nicht aufgeführt sind.

Unterstützt Datenmanagement unter Berücksichtigung von 21 CFR Part 11 und weiteren Anforderungen.

Analyseergebnisse lassen sich intuitiv prüfen.
Unterstützt Bericht- und Manuskriptentwürfe aus Analyseergebnissen.
Verbindet Analyse, Verwaltung und Reporting zur Verbesserung des gesamten Laborworkflows.
Each card separates the input data, the outputs IAS organizes, and the research decision it supports. Flow Cytometry, NGS, Molecular Structure, and MassSpec are treated as first-class analysis modes alongside Imaging.
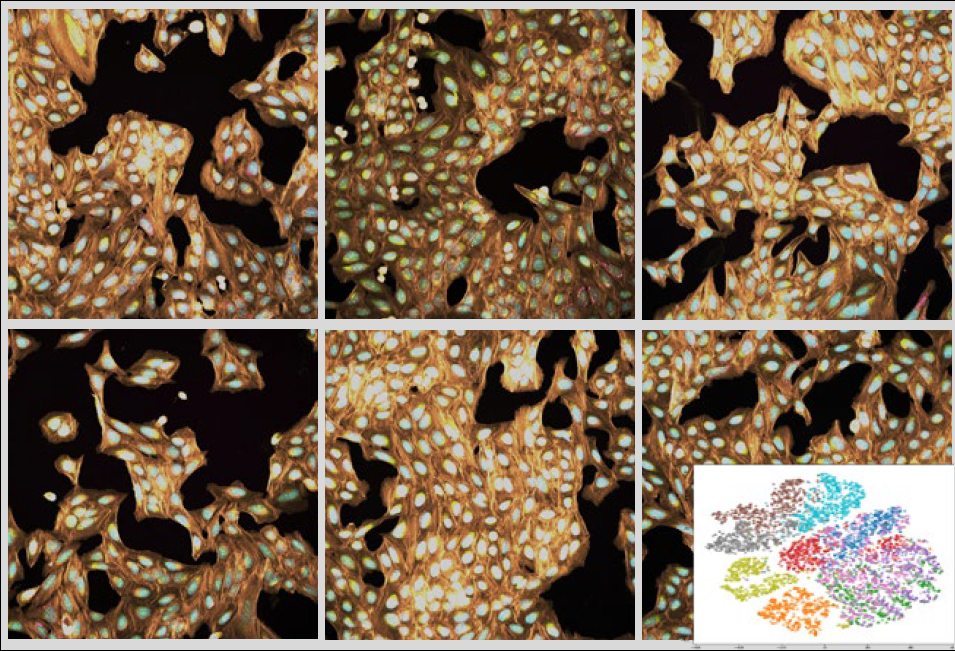
Für Wirkstoffsuche, Toxizität und Exploration
KI leitet unbekannte Wirksamkeit und Toxizität ab, indem spezifische Parameter und Krankheitsinformationen aus über 1000 Messparametern, über 100.000 Zellen und Organell-Extraktion verknüpft werden.
Für Gentherapie und iPS-Zellen
IAS unterstützt Prozesse, die eine bildbasierte Freigabeentscheidung erfordern, von Forschung und Entwicklung bis Produktion und Qualitätskontrolle von Stem Cells und iPS-Zellen.
Für Mäuse und ähnliche Modelle
Körper und Gliedmaßen kleiner Tiere lassen sich verfolgen und Gruppenverhalten analysieren, ohne durch Tag/Nacht-Bedingungen oder Fellunterschiede beeinträchtigt zu werden.
Proteins, materials, and structural evaluation
Manage 3D structures, segmented regions, features, and candidate models so structural differences and regions of interest are easier to compare.

Metabolites, quality evaluation, and component comparison
Manage spectra, peaks, sample conditions, and comparison groups to support component review, quality differences, and reporting.