
从目标化合物和候选药物倒推
连接疾病背景、既有数据、影像、组学和结构指标,明确要探索的药效、毒性和作用机制条件。
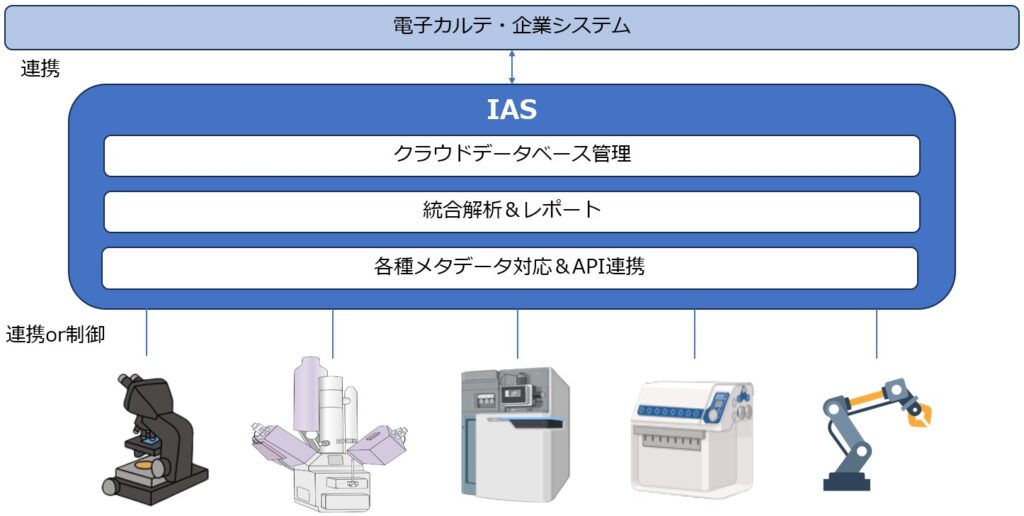
Integrate Analysis System IAS
IAS is not a replacement for every point tool. It is a web-based workflow layer that brings fragmented research data, analysis procedures, review records, and report creation into the same context.
IAS 不替代各模态的专用分析工具,而是把实验级数据、分析、复核和报告连接到同一个判断界面。
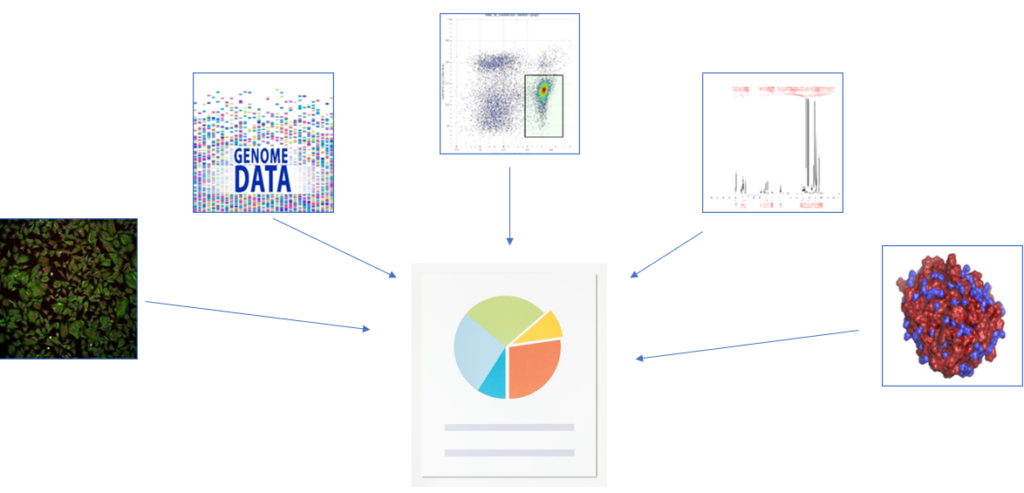
按实验整理影像、流式、基因组、质谱和分子结构等输出。
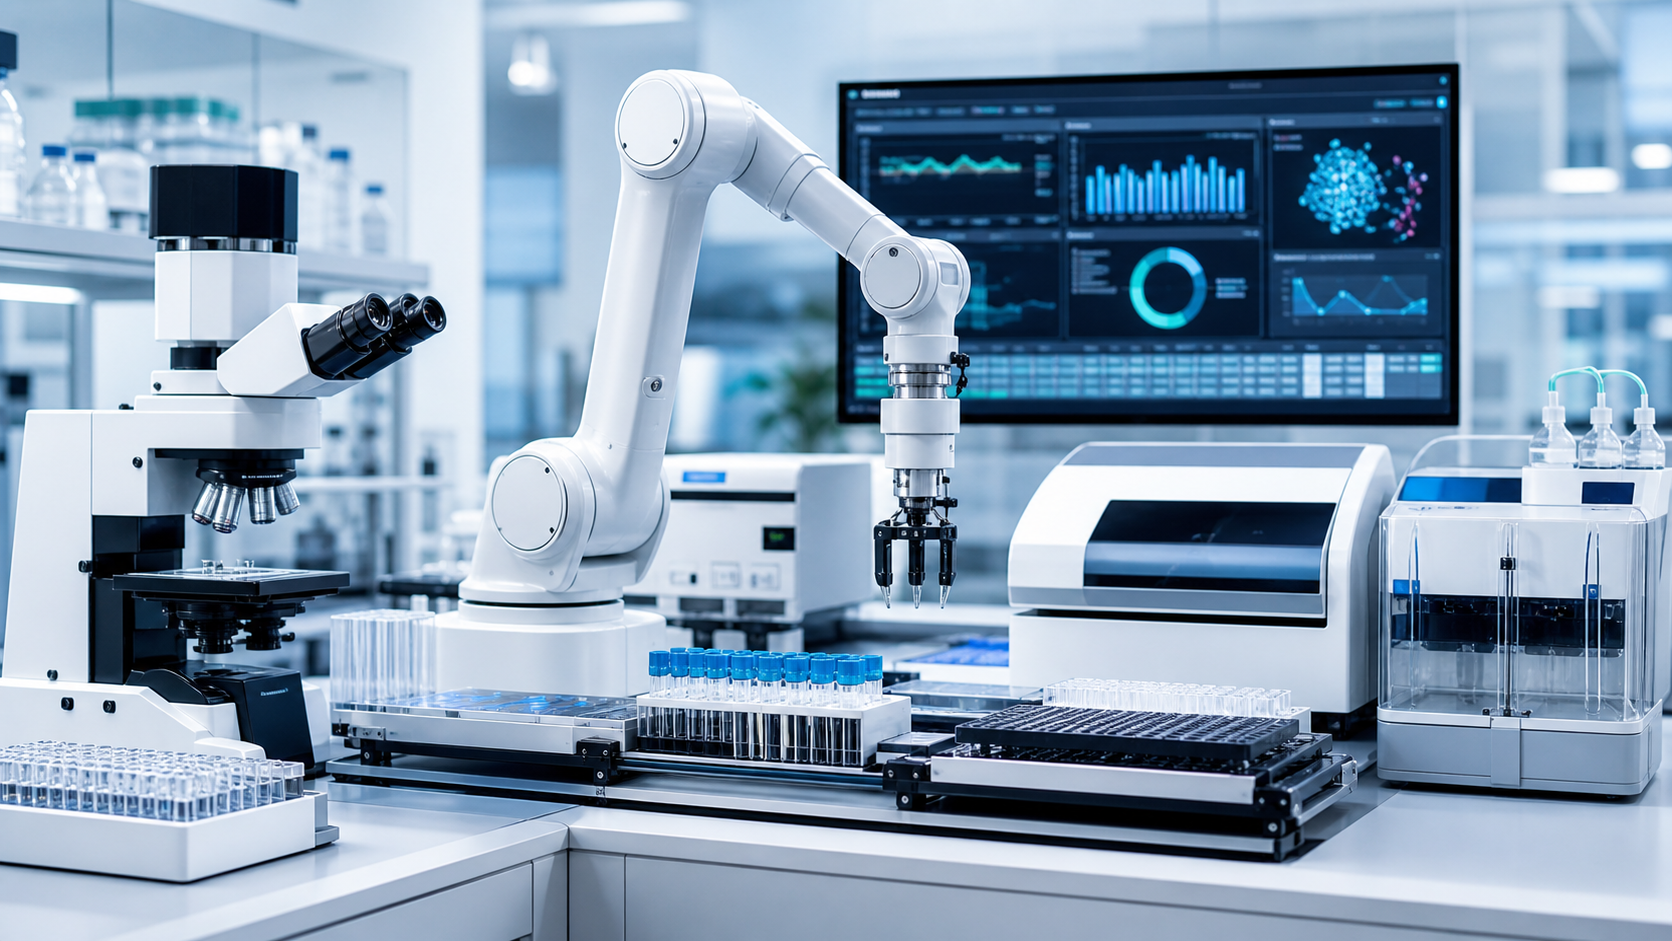
在同一工作区处理各模态分析方法,减少手工交接。
将多个检测结果连接到同一研究判断中,便于比较和解释。
连接分析历史、确认流程和报告制作,支持可再现的最终输出。
IAS 不只是展示分析结果,还会整理目标化合物、候选药物、假设、评价指标和下一步条件,使结果可以反馈到模拟和实验计划中。
除了提高分析和解释精度、提升报告效率外,IAS 还提升实验设计质量,缩短从候选探索到湿实验验证的研究周期。
连接疾病背景、既有数据、影像、组学和结构指标,明确要探索的药效、毒性和作用机制条件。
把有前景的条件、比较组和测定参数反馈到下一轮 in silico 评估或湿实验计划中,整理试验顺序。
提前筛除希望较低的条件,让实验、确认和复核集中在关键假设上,减少分析和湿实验双方的工时。
NEW FEATURE
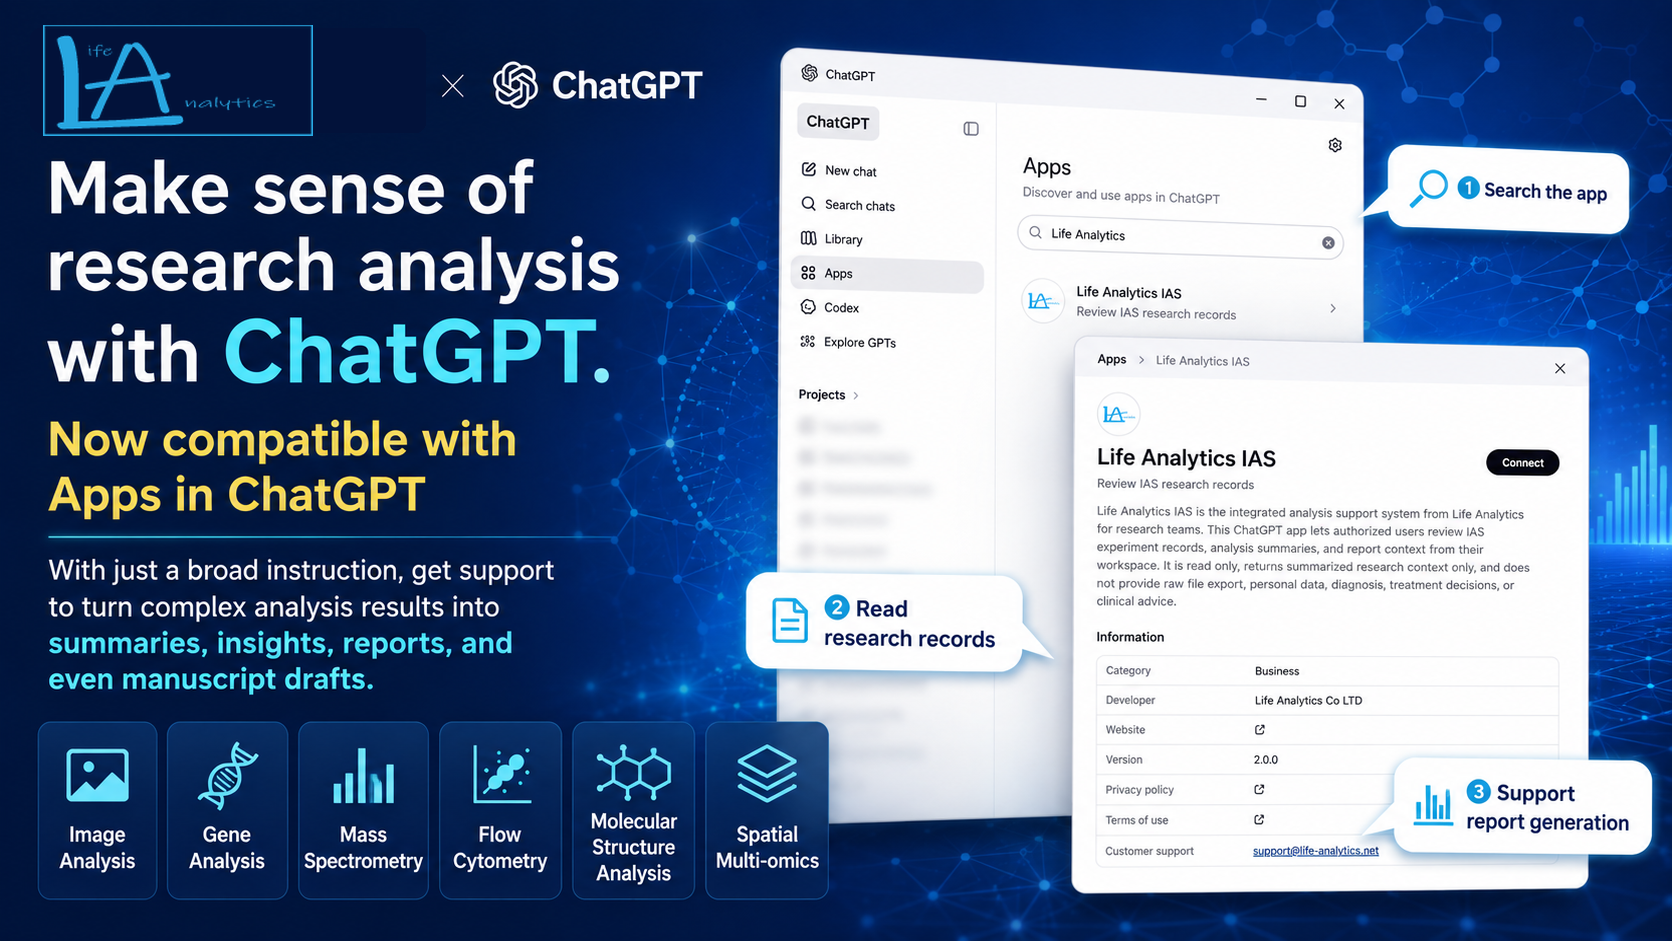
Helping researchers summarize, interpret, and draft reports from complex analysis results through natural language instructions.
LifeAnalytics IAS now supports ChatGPT and LifeAnalytics' proprietary generative AI application. Using research data, analysis history, experiment records, analysis summaries, and report context, IAS helps researchers summarize, interpret, create reports, and draft scientific manuscripts from complex life science analysis results.
IAS supports multiple analysis areas including image analysis, gene analysis, flow cytometry, mass spectrometry, molecular structure analysis, spatial multi-layer multi-omics analysis, and integrated analysis.
IAS 在云端集中管理影像分析、流式细胞、下一代测序、分子结构和质谱等代表性研究数据。
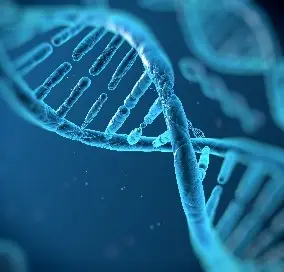
Visualization, alignment, assembly, and annotation of DNA and protein sequences.
Acquisition, processing, and analysis of mass spectrometry data, including metabolomics.
High-accuracy prediction of 3D protein structure from amino acid sequences.
AI-assisted discussion reports based on individual analysis results.
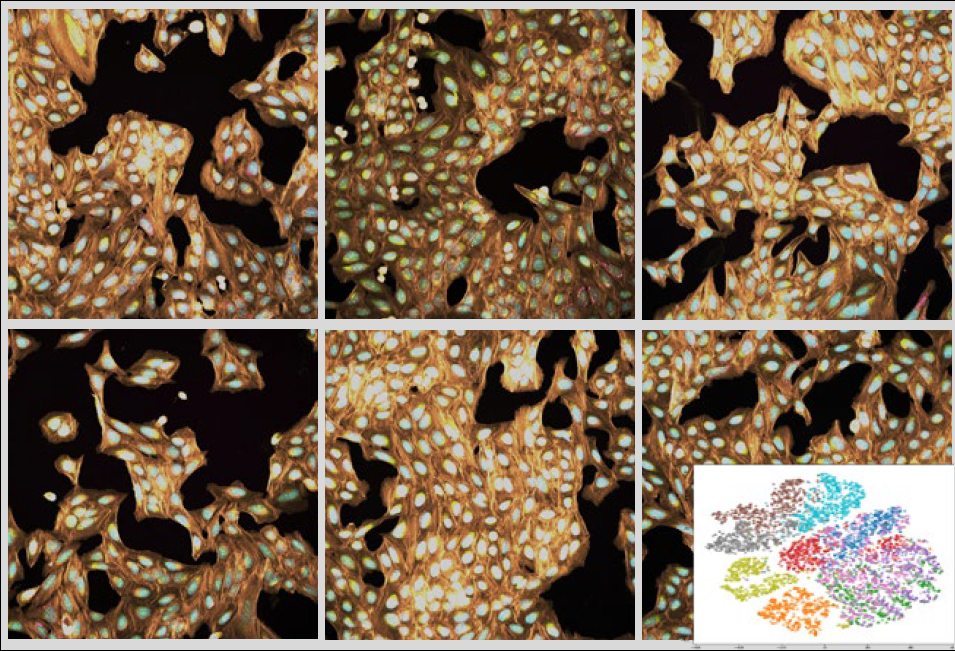
Image analysis for cells and tissue sections, including 3D, Timelapse, HCS, and pathology.
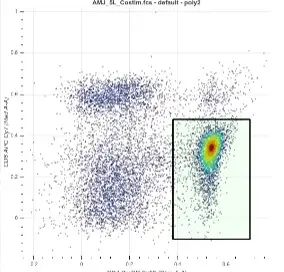
Flow cytometry analysis such as SPADE, U-MAP, and dot plots.
IAS specification details
Handle imaging, flow cytometry, genomics, mass spectrometry, molecular structure, and integrated analysis in one research workbench.
IAS is not a single image-analysis application or a collection of isolated point tools. It brings imaging, flow cytometry, genomics, mass spectrometry, molecular structure analysis, integrated analysis, and data management into one research workbench experience.
IAS AI output does not guarantee clinical diagnosis. Interpretation of pathology images, medical images, genomics, molecular structure, and mass-spec results should be combined with specialist review, raw-data inspection, standard methods, and external validation.
 Workflow diagram
Each card summarizes inputs, outputs, and review points at a practical evaluation level.

Long model inventories are grouped by purpose so readers can see how each model is used and what should be checked before interpreting outputs.
IAS imaging modes cover Tissue, Cell, Material, Semicon, Animal, and ML workflows so teams can choose models by purpose.
TissueNet, Foxp3 Spatial, Foxp3 DAB Spatial, Ki67-Br, Pathology, CT/MRI Segment, Spatial Omics, TissueNT2, Thyroid, and Lymph support tissue segmentation, ROI quantification, positivity review, spatial distribution, and multi-channel statistics.
Cyto, Cyto2, SAM, 2Dtracker, 3Dtimelapse, Nuclei, Nucleus01, Confluency, CM-CellCycle, LiveCell, CP, CPx, TN1-3, LC1-4, Single Cell Protein, 3DVD, LFcell02, and CellPaintingV3 support cell segmentation, tracking, morphology profiling, localization, and state review.
Pore Analysis, Layer, Microridge, Mfiber1, Mfiber2, Wafer, Mouse Dynamics Tracking, and Pixel Classification support pore, layer, ridge, fiber, wafer, animal motion, and user-defined pixel-classification reviews.

Pathology mode combines local pathology processing, ROI editing, vision-language assistance, visual similarity, and nuclei/cell segmentation support.
OpenSlide, tifffile, OpenCV, and LAB/HSV/RGB Magic Wand support tissue masks, tile heatmaps, overlays, and color-space ROI editing.
Qwen2.5-VL + LoRA assist, ResNet152 visual similarity, and DeepLIIF biomarker support help generate descriptions, hypotheses, similar-image candidates, and biomarker-support summaries.
checkpoint-gated tumor segmentation, StarDist H&E nuclei, Cellpose-SAM service, and InstanSeg service provide candidate segmentation for tumor regions, nuclei, and cells.
This is not a diagnostic function. Outputs are research and review support for specialist-led pathology review.
IAS connects FCS input, compensation, QC, gates, embedding, clustering, statistics, and reporting.
Compensation, spectral unmixing, PeacoQC, DataQC, doublet checks, and margin checks help review spillover, spectral overlap, abnormal events, flow-rate drift, doublets, and margin events.
Gate editor, Boolean gates, UMAP, t-SNE, opt-SNE, and viSNE help preserve manual thresholds and inspect high-dimensional cytometry data.
FlowSOM, SPADE, CITRUS, population statistics, and marker summaries support population comparison, MFI review, figures, and reports.
Embeddings are visualizations; interpretation should be checked against marker expression and manual gates.

IAS organizes sequence similarity, alignment, variants, single-cell analysis, reference mapping, and multi-omics evidence by experiment.
BLAST, MSA, Phylogeny, CRISPR, QC & Alignment, Variant Calling, Joint Genotyping, and Annotation connect sequence review to variant and annotation review.
Genome Browser and Single-cell Async support genomic-region inspection, variants, gene models, normalization, HVG, PCA, clustering, UMAP, and marker detection.
Harmony, scGPT, cell annotation capability checks, and Multi-Omics connect batch correction, reference mapping, cell-type annotation candidates, expression, variants, phenotypes, and other modes.
Check genome build, QC, depth, population frequency, labeled references, batch effects, missingness, and unit alignment.

IAS connects raw/mzML/mgf/wiff inputs to peak features, identification, quantification, QC, database matching, reports, and multi-omics.
MS-DIAL, XCMS, MZmine, MS-FINDER, MS-CleanR, LipidSearch, and LipidBlast outputs are organized for candidate review and quantification.
MaxQuant, Proteome Discoverer, FragPipe, Mascot, Byonic, Spectronaut, DIA-NN, OpenSWATH, Prosit, SCiLS Lab, Cardinal, MSiReader, METASPACE, and OpenMSI outputs can be reviewed as part of the same workflow.
MRM/SRM/PRM, MRMProbs, DeepNovo, Spec2Vec, MS2DeepScore, AlphaPept, mixOmics, MOFA(+), DIABLO, and OmicsNet outputs can be tied back to research decisions.
AI candidates should be verified with database matching, standards, MS/MS evidence, FDR, QC, blanks, and batch correction.

IAS helps review the path from Sequence/PDB/Ligand to structure prediction, docking, MD, validation, and reports.
Monomer and complex structure prediction, public structure retrieval, and pLDDT/PAE review are handled as review inputs.
GNINA, AutoDock-family, LightDock path, OpenMM, and mdtraj support binding-pose candidates, scores, binding-site review, RMSD/RMSF, interactions, and solvent-condition review.
Validation quality checks, reports, function annotation, spectrum prediction, knowledge graph, QM, and FEP scaffolds help organize quality and extension candidates.
Check confidence, pLDDT/PAE, protonation, box, charge, ligand preparation, force field, solvent, temperature, and simulation length.

IAS connects imaging, genomics, mass spec, flow cytometry, molecular structure, and reports around a consistent sample ID.
sample ID and provenance mapping connect sample IDs, experiments, files, and preprocessing history across modes.
compute-statistics, random-effects meta-analysis, and cross-modal review connect effect sizes, confidence intervals, heterogeneity, imaging features, gene expression, metabolites, and population ratios.
Gen Report, report history, evidence maturity, DB Manage, and Sample DB help preserve report context, input history, file references, mode estimation, and re-analysis paths.
For clinical research support, keeping the same sample ID across Imaging, Genomics, MassSpec, and FlowCyto is critical.
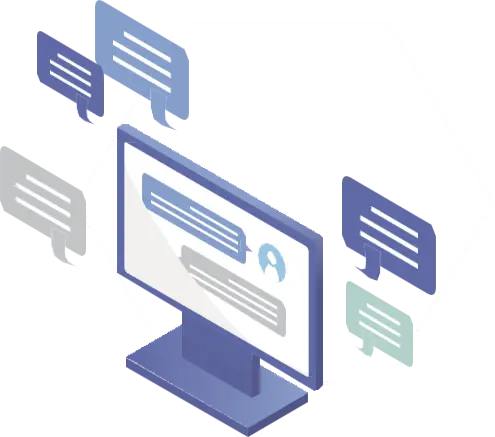
Support functions reduce uncertainty during analysis by connecting operation guidance, knowledge search, ROI questions, and help dialogs.
Support Chat connects operation guidance, inquiry handoff, knowledge search, and AI-answer support for Imaging, Genomics, FlowCyto, Molecular, MassSpec, and Integrate.
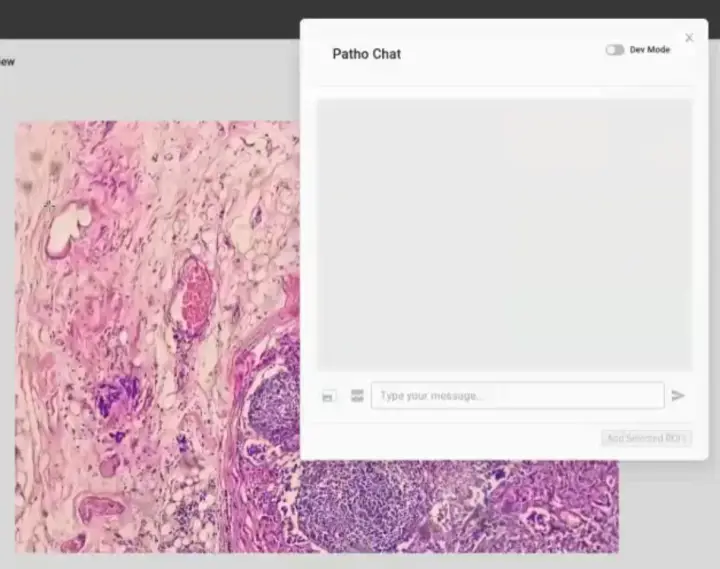
Patho Chat combines ROI crops, feature extraction, similarity candidates, and Qwen-family LLM support to provide finding candidates, differential candidates, and suggested checks under pathology-specialist review.
Q&A icons and Help screens reduce operation mistakes through tooltips, Quick Start, Help dialogs, shortcut explanations, and Support Chat / Patho Chat visibility controls.
Patho Chat does not replace pathology review. Outputs are confirmation support and hypothesis-generation support for selected ROIs.

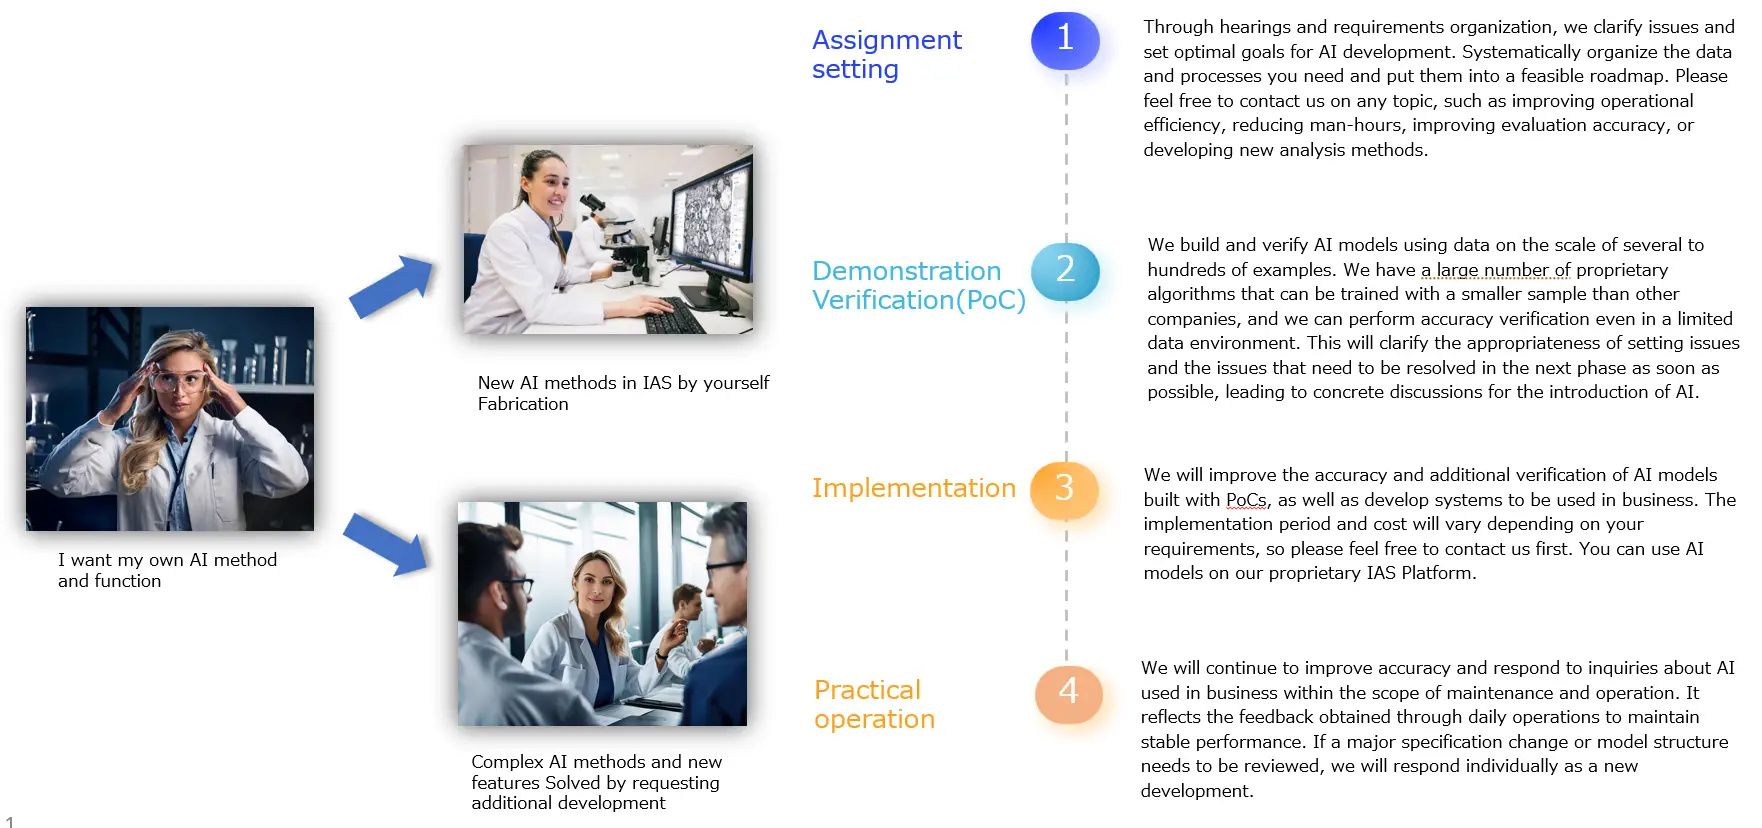
Your target data, analysis problem, and evaluation timing do not need to be fully organized. We can review the appropriate analysis modes and implementation path with you.
Demo consultation将基础研究的分析方法统一到同一环境中,帮助研究人员以可再现的方式推进工作。
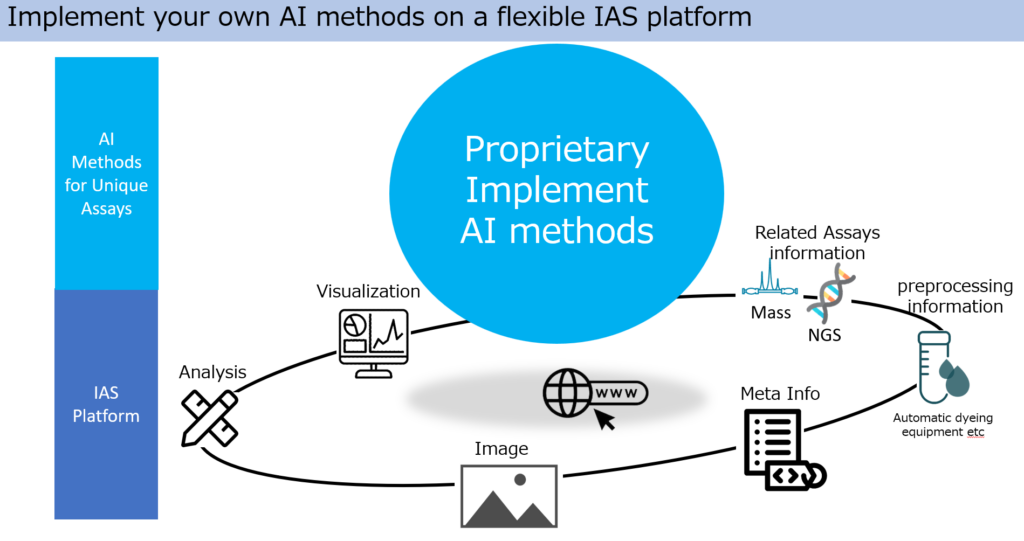
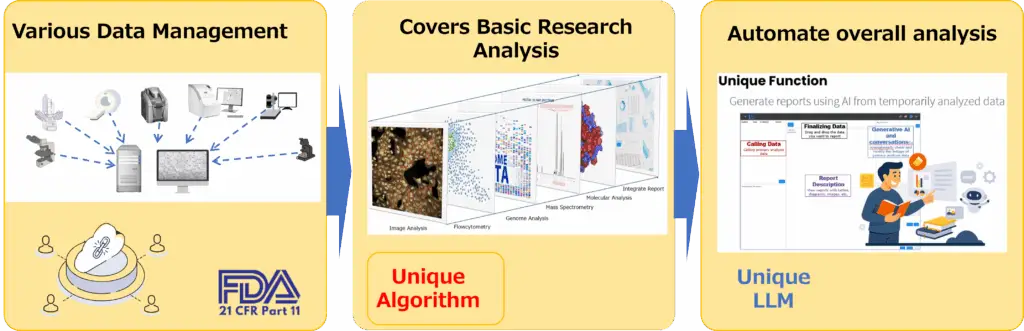
可根据目标开发专用 AI 和分析功能,支持研究流程整体自动化。
在一个 Web 系统中管理数据、分析和报告。
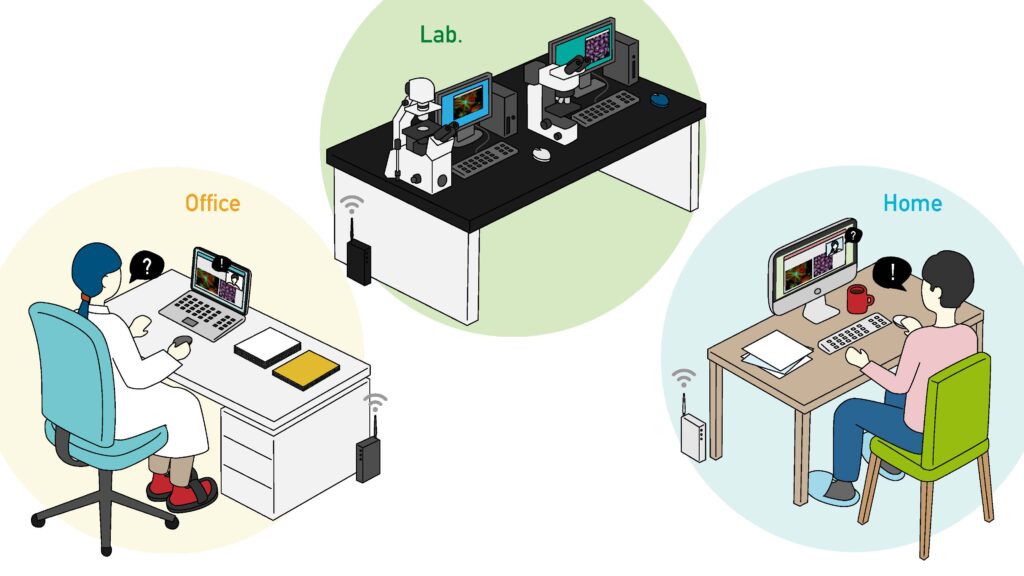
无需本地安装,协作和远程环境也可使用同一分析平台。
分析过程中可顺畅推进问题咨询和确认。
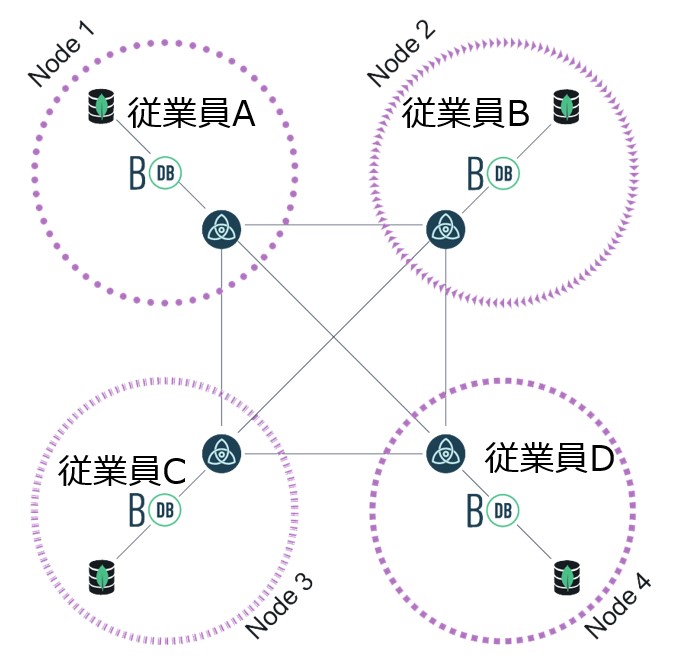
适合数据管理、防泄漏和法规应对的系统构成。
从影像和分析结果中辅助发现值得关注的点。
支持研究现场使用的多样数据格式整合。
专业分析流程更易共享,提升远程共同研究的再现性。
集中管理多种数据格式,减少分析和报告制作所需时间。
支持各种独特的图像格式和分析格式,作为数据综合分析系统发挥作用。
如需使用未列出的格式,也请联系我们。

支持考虑 21 CFR Part 11 等法规要求的数据管理。

通过可视化工具直观确认分析结果。
基于分析结果支持报告和论文草稿制作。
连接分析、管理和报告制作,提升实验室整体效率。
Each card separates the input data, the outputs IAS organizes, and the research decision it supports. Flow Cytometry, NGS, Molecular Structure, and MassSpec are treated as first-class analysis modes alongside Imaging.
面向药物发现、毒性和探索研究
通过提取 1000 项以上测量参数、10 万以上细胞数和细胞器官信息,将特异参数与疾病信息关联,并由 AI 类推未知药效和毒性。
面向基因治疗和 iPS 细胞
从干细胞、iPS 细胞等研发到生产和质量管理,支持需要图像合格判定的各个流程。
面向小鼠等模型
不受昼夜、体毛差异等条件影响,支持小动物身体和四肢的动态追踪以及群体行为分析。
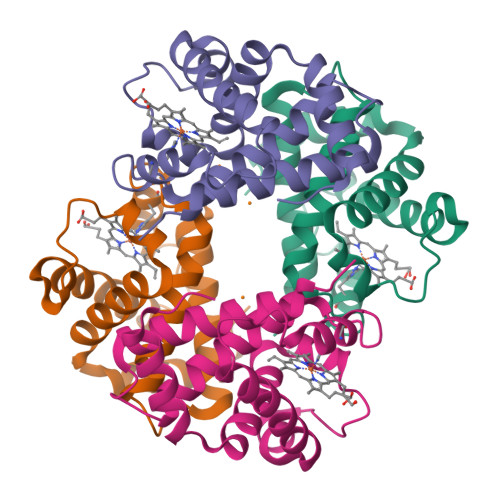
Proteins, materials, and structural evaluation
Manage 3D structures, segmented regions, features, and candidate models so structural differences and regions of interest are easier to compare.

Metabolites, quality evaluation, and component comparison
Manage spectra, peaks, sample conditions, and comparison groups to support component review, quality differences, and reporting.